Live Dashboards with Redash and Rockset
January 23, 2019
Redash is a powerful open source query and visualization tool that helps you make sense of your data. It connects to variety of data sources and also includes a native connector for Rockset. In this post we will demonstrate how to use Redash to build live dashboards on Rockset data sets.
Configure
If you've never used Redash before, you need to set it up first. You have two options: either run it yourself or use the hosted version provided by Redash.
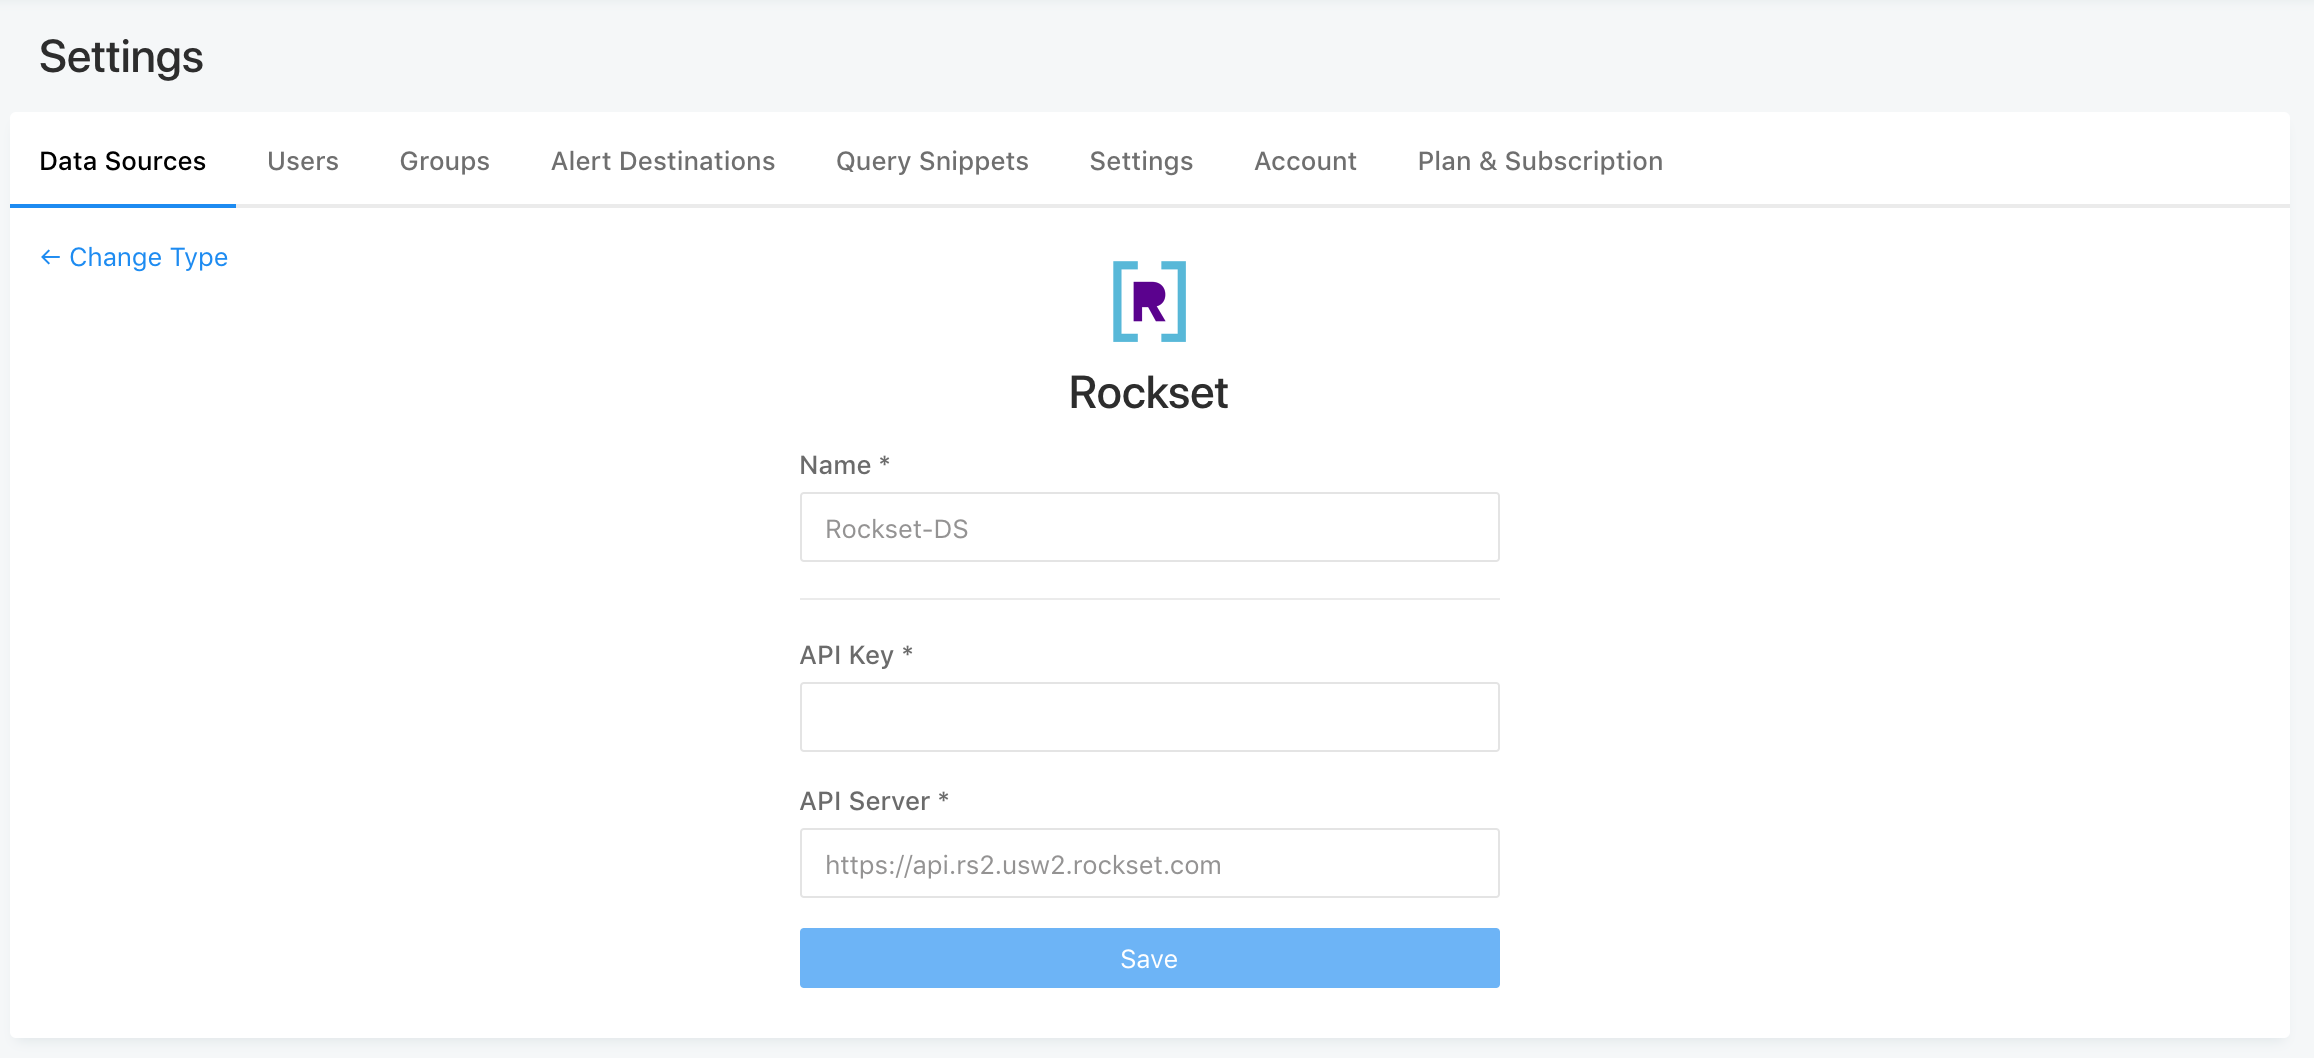
Once you have set up Redash, you need to create a new Rockset data source. Read about Redash adding Rockset as a supported data source in Redash v6.
Look for "Rockset" in the New Data Source view.

To configure the data source, you should give it a name and an API key that you can create in the Rockset console. In most cases you can leave API Server as is, using https://api.rs2.usw2.rockset.com.

Query
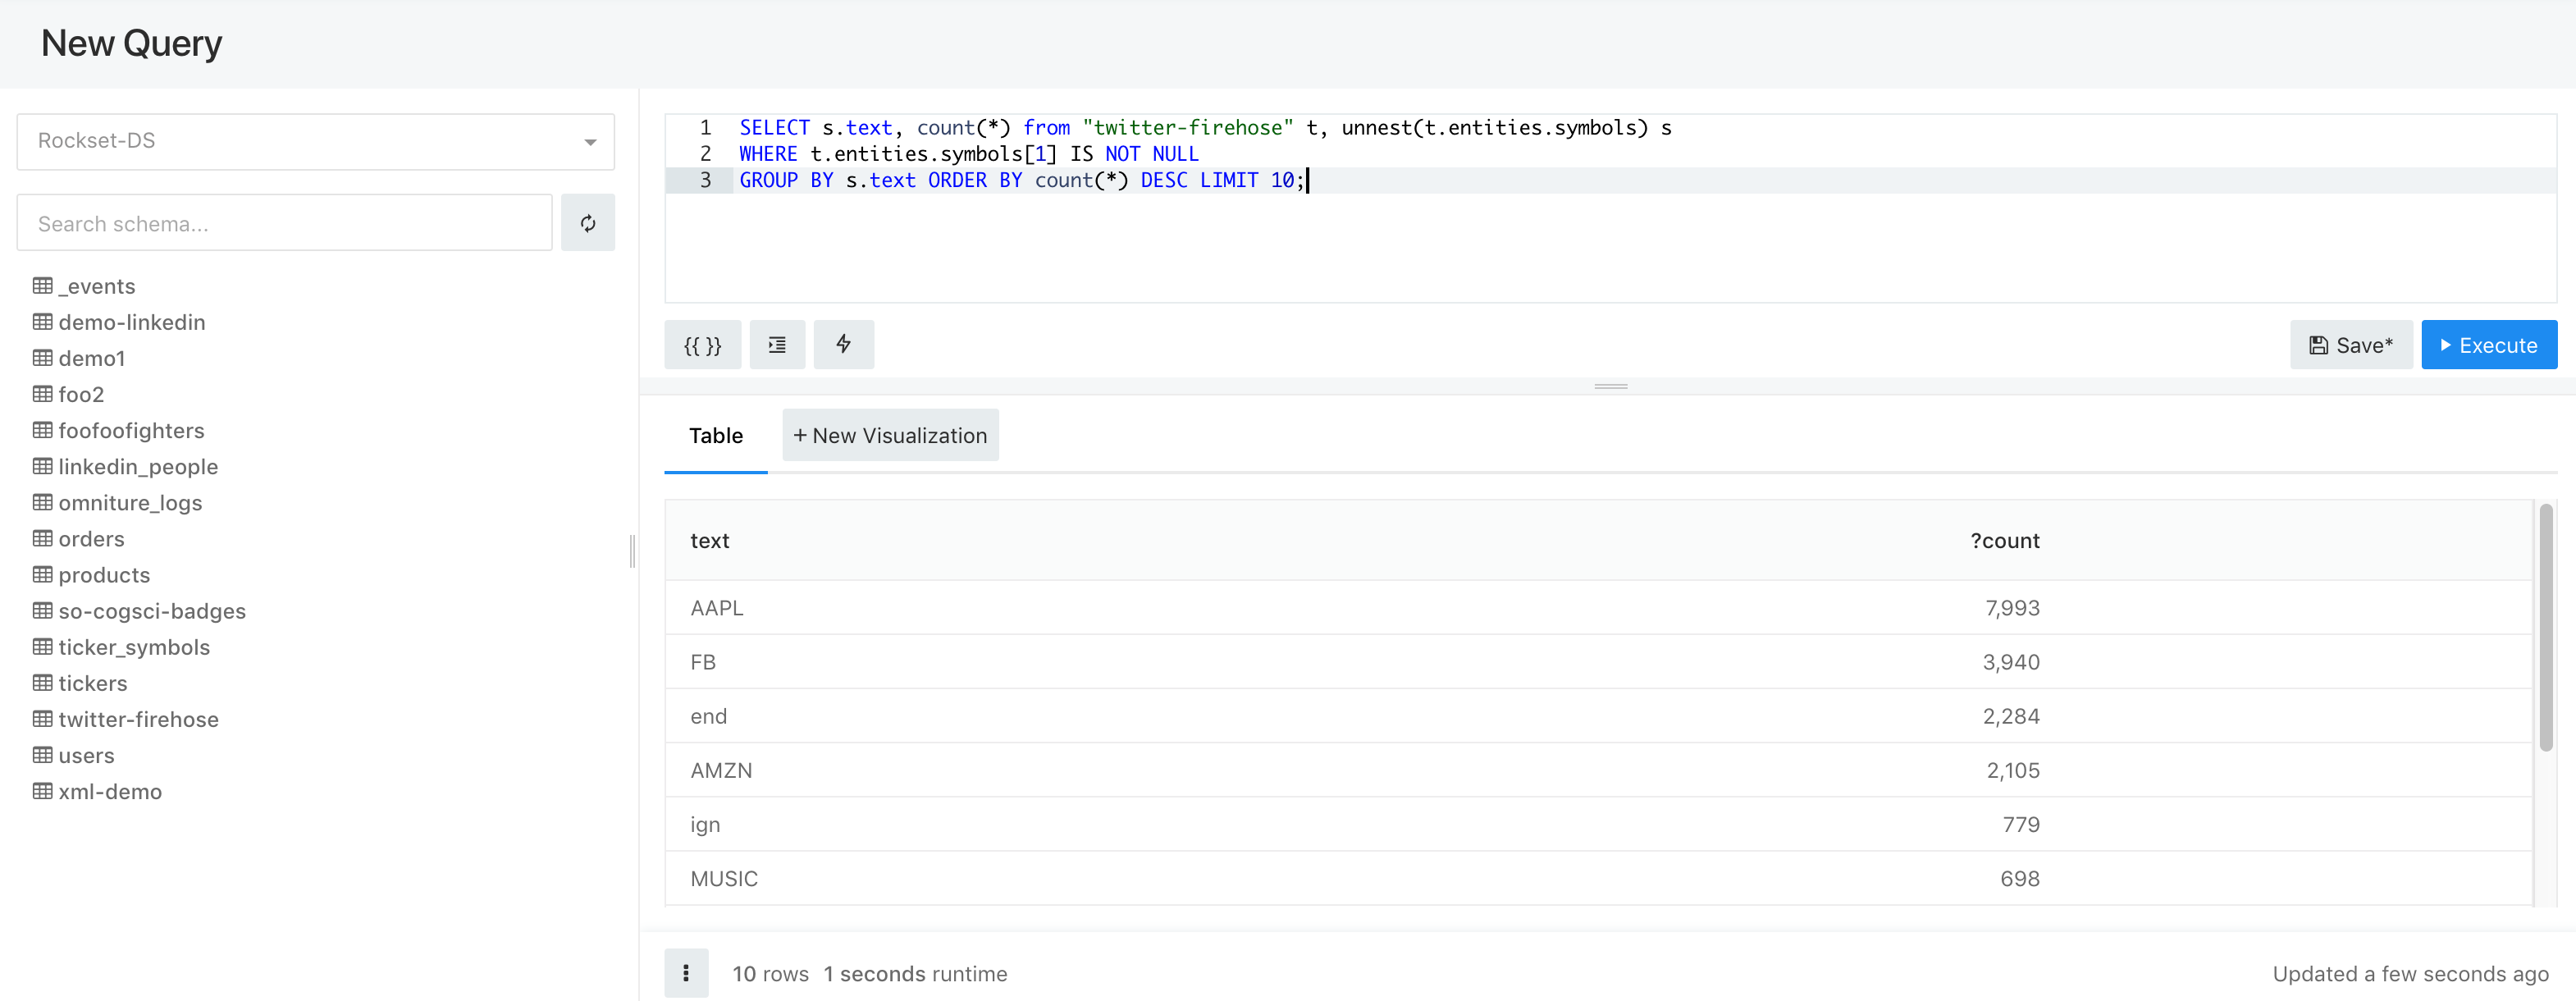
Create the data source and you are ready to query Rockset! On the first load you might need to give some time for Redash to preload the schema of all Rockset tables. Once that's done, you should see a list of all Rockset collections in your account and you can start executing SQL statements. Click Create in the nav bar and then Query to start your SQL query.

Live Dashboards and Visualizations
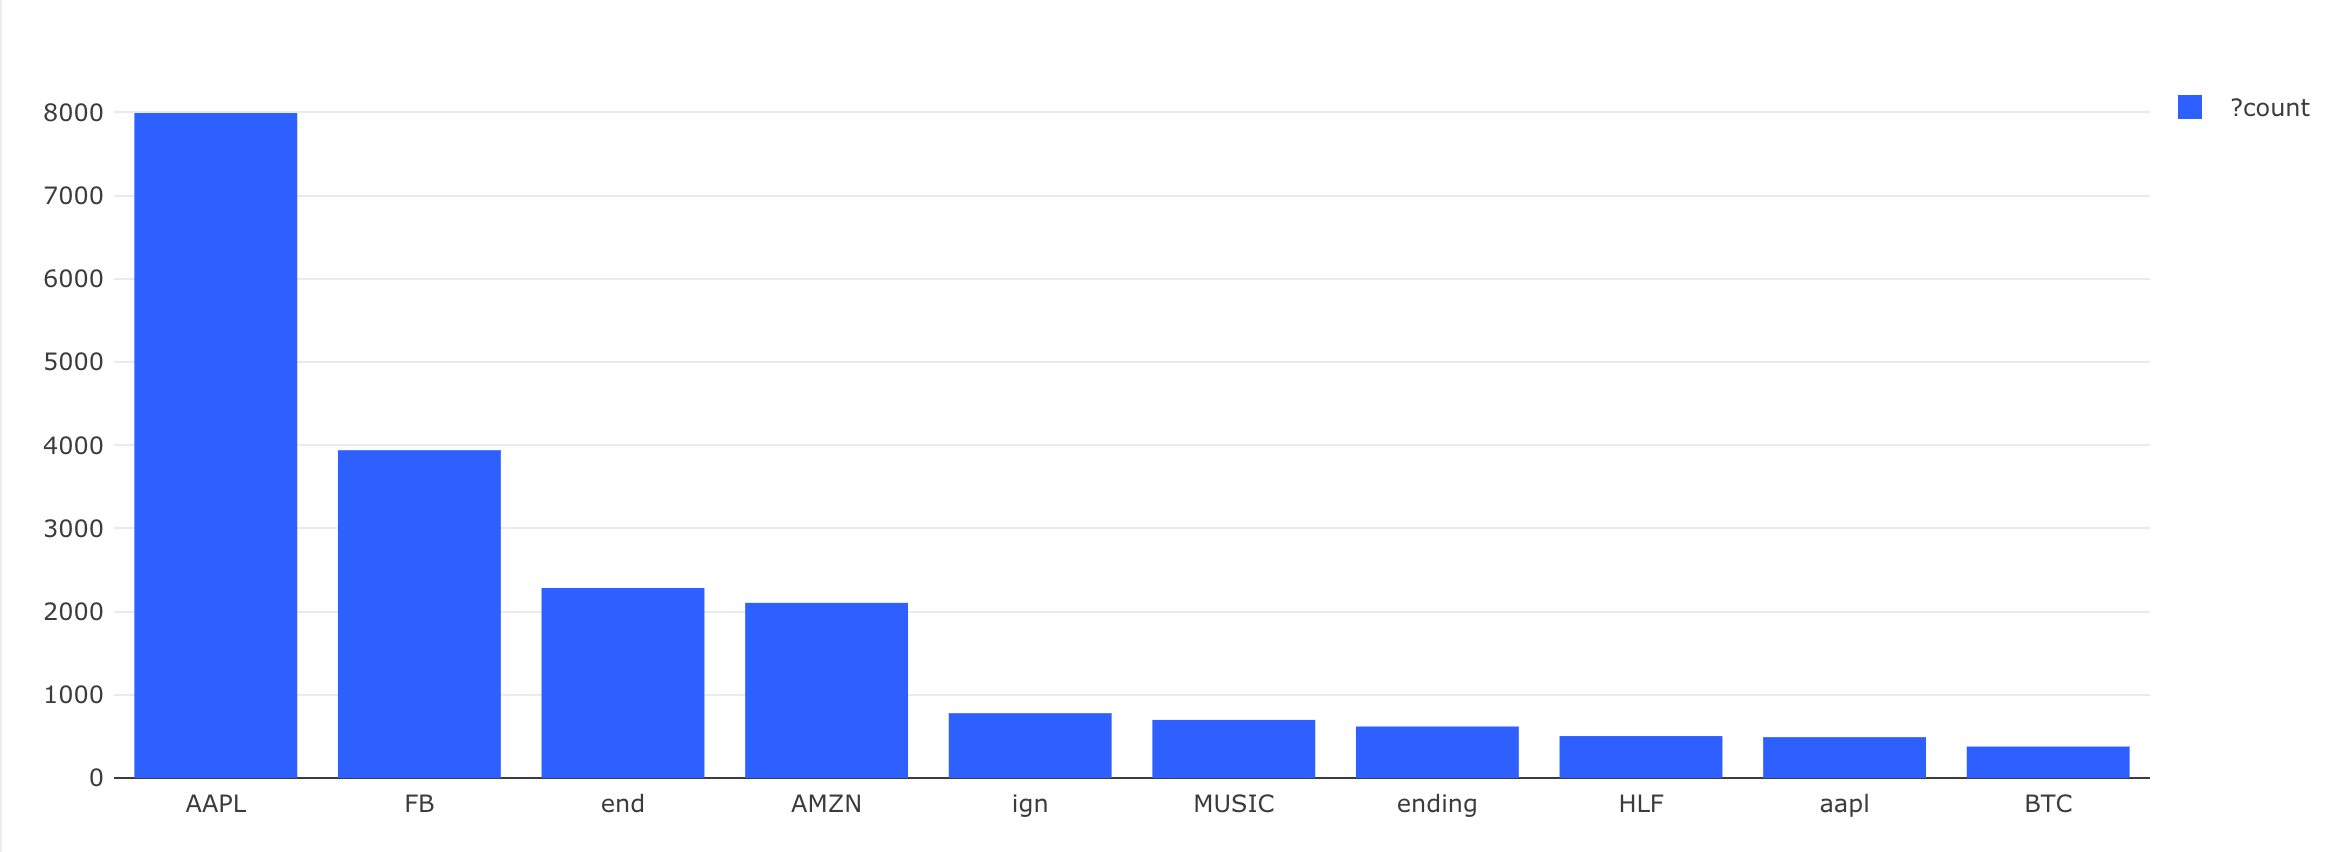
By default, Redash shows you a table with results of the query. However, you can also build rich dashboards and visualizations based on your results. Click on New Visualization, and from there you can select many different visualization options, such as Bar charts, Pie charts, Scatter plots and others. You can also add the visualization to a dashboard that will automatically refresh as new data comes in.

Find more info on the Rockset-Redash integration in our docs. Give it a spin and let us know what you think!